
The True Cost of 3D Printing: Total Cost of Ownership for Labs and Aligner Manufacturers
For high-volume dental labs and aligner manufacturers, investing in additive manufacturing equipment is a complex business decision. There are a number of key metrics to consider and this white paper breaks it down. Here we examine:
-
How to calculate cost per part, and why CPP is 47% less for parts printed on Form 4L versus leased industrial systems;
-
The reliability of Form 4 Generation 3D printers, including a 97%+ print success rate;
-
The accuracy of Form 4L/BL 3D printers, with heatmaps of models for thermoforming, restorative models, occlusal splints, and surgical guides;
-
Additional indicators, including return merchandise authorization rate, resin consumption, and Net Promoter Score.
By considering a comprehensive Total Cost of Ownership calculation, dental labs and aligner manufacturers can gain a clearer picture of the economics of high-volume production, and how a fleet of industrial dental 3D printers like Form 4L/BL is more cost-efficient than legacy leased industrial systems.
The True Cost of 3D Printing: Total Cost of Ownership for Labs and Aligner Manufacturers
For high-volume dental labs and aligner manufacturers, investing in additive manufacturing equipment is a complex business decision. There are a number of key metrics to consider and this white paper breaks it down. Here we examine:
-
How to calculate cost per part, and why CPP is 47% less for parts printed on Form 4L versus leased industrial systems;
-
The reliability of Form 4 Generation 3D printers, including a 97%+ print success rate;
-
The accuracy of Form 4L/BL 3D printers, with heatmaps of models for thermoforming, restorative models, occlusal splints, and surgical guides;
-
Additional indicators, including return merchandise authorization rate, resin consumption, and Net Promoter Score.
By considering a comprehensive Total Cost of Ownership calculation, dental labs and aligner manufacturers can gain a clearer picture of the economics of high-volume production, and how a fleet of industrial dental 3D printers like Form 4L/BL is more cost-efficient than legacy leased industrial systems.
Cost Per Part (CPP)
Why Cost Per Part?
The true cost of a 3D printed part is rarely reflected in the price of the resin. In high-volume dental production, indirect costs — specifically hardware amortization and labor — can exceed material costs if not strictly managed.
Some industrial additive manufacturing (AM) equipment is based on a subscription pricing model. While this reduces upfront CapEx, it creates a fixed recurring fee for the lifetime of the production line. Conversely, ownership-based models front-load CapEx but allow the per-part cost to asymptotically approach the material cost as volume increases.
Below, we break down the calculations for determining CPP, followed by two examples.
In the example outlined below, legacy leased systems have a CPP for aligners for thermoforming of $0.97, versus a CPP of $0.52 for Form 4Ls that are owned outright. This is a savings of 47% per part.
Calculating Total CPP
CPP is calculated using the formula:
CPP= ((hardware + service) / lifetime volume) + (material cost / parts printed) + (consumables cost / parts printed) + (labor rate / parts printed) + (software costs / parts printed)
To simplify, total CPP is the sum of four components: amortization, material, consumables, and labor.
CPPtotal = Camortization + Cmaterial + Cconsumables + Clabor + Csoftware
Below, we break down each part of this equation, including the differences in determining it for leased versus owned equipment.
Hardware Amortization (Camortization)
This variable represents the cost of the equipment attributed to a single part.
-
Ownership model: Ca = (hardware price + service contract) / lifetime volume (Parts)
-
Subscription model: Ca = annual lease fee / annual volume (parts)
In subscription models, Ca remains static or rises if volume targets are missed. In ownership models, Ca decreases as throughput increases. For example, in an ownership model, doubling print speed halves the amortization cost per part.
This means that for 3D printers like Form 4L, which are owned outright, the costs of hardware and service are lower than the annual lease fee of legacy systems while delivering the same annual volume.
Effective Material Cost (Cmaterial)
As hardware costs diminish due to volume, material cost becomes the primary consideration. Material cost is not simply the price per liter of material, but must also account for waste due to resin lost to platform adhesion, tank cleaning, and failed prints or parts. In the formula below, omega represents this waste resin.
Cmaterial = (price per liter / 1000 mL) * part volume (mL) * (1 + omega)
Some key material considerations:
-
Most resin manufacturers, including Formlabs, offer bulk discounts on resin purchases. Therefore, purchasing resin in bulk will result in a lower effective material cost.
-
Due to the scale of throughput, a differential of just $10 per liter (e.g., paying $39/L vs. $29/L) can amount to millions in lost margin annually for a large lab.
-
Systems that require large, unused volumes of resin in the tank or have high failure rates maximize material waste, substantially increasing the total material cost (omega in the formula above).
Consumables (Cconsumables)
The cost of consumables is often hidden in the total cost of equipment ownership. The following consumables should be considered when determining cost per part:
-
Resin Tanks: Defined by the tank life (parts per tank)
-
Solvent (IPA): Defined by saturation limits (parts washed before disposal/recycling)
Cconsumables = (tank cost / tank life) + (solvent cost / saturation limit)
Form 4L/BL resin tanks are designed to exceed 75,000 layers of printing with any Formlabs material when maintained directly and do not require replacing when this threshold is reached. This means producing 10K+ models per tank or 20K of occlusal splints per tank. Learn more about resin tank lifespan in this article.
Labor (Clabor)
One of the highest costs for a lab is labor. The cost of human intervention in the manufacturing process is calculated using the following formula, which determines the labor costs associated with the production of a single part.
Clabor = ((prep time + post-process time) / parts per batch) * (hourly rate / 60)
Labor may include:
-
File Prep: Automated nesting and packing software (e.g., Preform) is essential.
-
Physical Touchpoints: Removing parts from the build platform and washing/curing.
-
Changeovers: Time spent swapping resin tanks or refilling cartridges.
The fewer touchpoints required for a workflow, the lower labor costs. Aligner manufacturer SecretAligner found that, though their Prismlab printers part removal was automated, the time it took for a person to sort parts was more costly than the same throughput on Form 4L, in which their models could be sorted by print batch, eliminating the need for manual sorting.
Insight: Automation features, such as automatic resin pumping and quick part release build platforms (like Formlabs' Flex Build Platform), reduce the "prying force" needed to remove parts, cutting labor time per build by minutes.
Software (Csoftware)
Most leased legacy systems require a paid software subscription. This is an ongoing cost throughout the use of the system.
Csoftware = software costs / parts printed
The higher the throughput, the lower the software cost per part. Formlabs PreForm is a free print preparation software, meaning no additional software costs. Additionally, with the Formlabs Production Pipeline print set up can be automated with zero clicks at scales of 1,000+ parts an hour, for zero software costs once designed and no labor costs associated with print set up.
CPP Analysis: Form 4BL vs. Leased Legacy System
To illustrate the financial impact of these variables, we modeled the CPP of a high-volume aligner production facility, showing the math for owning and operating Form 4Ls versus operating a leased system (also known as a subscription model).
In this scenario, the manufacturer is producing clear aligner models for thermoforming with an annual volume of 1,000,000 parts and a production term of five years.
Hardware Cost
|
Leased Legacy System |
Owned Form 4L |
|
|
Printer cost |
Annual subscription ~$40,000 |
$5,930 + $999 + 349 + $8,250 for a five-year service plan = $15,528 |
|
Printers required to produce 1M parts |
5 |
4 |
|
Total annual hardware cost |
$200,000 |
$63,000 ($12,422.40 amortized over 5 year expected lifetime) |
|
Calculation |
$200,000 / 1,000,000 parts |
$12,422.40 / 1,000,000 parts |
|
Amortization per part |
$0.20 |
$0.012 |
*Amortized over five years.
Material Cost
|
Leased Legacy System |
Owned Form 4L |
|
|
Resin Price |
$37 / L |
$28 / L (bulk resin discount) |
|
Volume per Part |
10 mL |
10 mL |
|
Calculation |
($37 / 1000mL) * 10.0mL |
($28 / 1000mL) * 10.0mL |
|
Material cost per part |
$0.37 |
$0.28 |
Consumables
|
Leased Legacy System |
Owned Form 4L |
|
|
Tank cost |
$12,000 / year / printer (fixed fee) |
$299 per tank |
|
Calculation |
($12,000 * 5 printers / 1,000,000 Parts |
$299 / 12,500 Parts |
|
Consumable cost per part |
$0.06 |
$0.0239 |
Labor
|
Leased Legacy System |
Owned Form 4L |
|
|
Labor (at $50/hour) |
1 FTE per shift |
1 FTE per shift |
|
Labor cost per part |
$0.20 |
$0.20 |
Software
|
Leased Legacy System |
Owned Form 4L |
|
|
Cost of software per part |
$0.14 |
$0 |
Carbon charges a fee per model to hollow and nest. Formlabs software is free.
Total CPP
|
Leased Legacy System |
Owned Form 4L |
|
|
Calculation |
Hardware + Materials + Consumables + Lab |
Hardware + Materials + Consumables + Lab |
|
Total CPP |
$0.97 |
$0.52 |
|
Cost for 1M Parts |
$970,000.00 |
$516,342.40 |
Curious to see what this would look like for your business? Contact our sales team to calculate your costs.
Reliability
Reliability is a quantitative measurement of repeatability. Variable reliability means interruptions to workflow, resulting in overall production. Historically, industrial systems have been viewed as more reliable than desktop systems, but this performance gap has closed.
We analyzed the field data from more than 1,200 Form 4L/BL and 1,100 Form 4B 3D printers from around the world, focusing on model production with Fast Model Resin and Precision Model Resin, to quantify reliability. The results found that Form 4 Generation 3D printers had a print success rate of 97%+.
Print Success Rate
Formlabs defines print success rate as:
Print success rate (%) = (total number of prints started - total number of failed prints) / total number of prints started
In the formula above:
-
The total number of prints started is a count of unique prints for all online printers, excluding Formlabs R&D printers.
-
The total number of failed prints is a total count of prints with preprint errors, in-print errors, in-print aborts, and prints voted as failures*. Prints that the user aborted pre-print are excluded from this.
-
If a single part in a build fails, the entire build is considered a failure as long as it’s identified before the vote.
*Prints voted as failures are user-reported.
The print success rate of Form 4/B printers for Fast and Precision Model resins among dental customers is 97% based on data from January 2026 to May 2026.
Insight: This success rate implies that in a batch of 100 aligner models, statistically, only two failures will occur. This places Form 4 Generation 3D printers in parity with legacy industrial systems.
Root Cause of Failures
In examining the failures above, we found the following:
-
User and environmental errors accounted for 66% of failures. This includes failures caused by dirty optics, empty resin cartridges, improper support generation, or unlevel surfaces.
-
Hardware and software issues were 20%, including firmware errors, sensor drift, or mechanical issues.
-
Process and materials accounted for 14%. This includes resin expiration or adhesion issues.
Two-thirds of failures are process-related. Therefore, a lab can achieve improved reliability simply by implementing Standard Operating Procedures (SOPs) for cleaning and setup, rather than buying more expensive hardware.
Accuracy
Accurate models and appliances ensure a perfect fit. In production environments, reliably producing accurate models and appliances keeps yield high and reduces remakes. Therefore, in addition to cost per part and yield, accuracy is a key metric in determining the cost of production, as remakes waste time, material, and labor.
Two accuracy studies were performed by Formlabs: one in a dental lab environment, and the second in an aligner production environment. For both, the following is true:
-
All prints for the study were split between three different Form 4BL 3D printers.
-
A Medit T100 scanner was used for the surface scan of the printed parts.
-
Zeiss Inspect Optical 3D 2025 software was used for the analysis by superimposing the STL file to the scanned file of the part.
Below, we break down the test prints and findings.
Dental Lab Environment
Four different tests were performed in the dental lab environment:
-
Study models in Precision Model Resin at 100 μm layer height
-
Study models in Precision Model Resin at 50 μm layer height
-
Occlusal splints in Dental LT Comfort Resin at 100 μm layer height
-
Edentulous surgical guides in Surgical Guide Resin at 100 μm layer height
For these tests, three models or appliances were printed on three different Form 4BL 3D printers, washed in Form Wash L, and post-cured in Form Cure L. Automatic orientation and print set-up in PreForm was used and the default print parameters were used for each resin. For post-processing, the manufacturer’s instructions for use for the resin were followed.
Restorative Models Printed in Precision Model Resin
|
Layer Height |
+/- 100 µm Average |
+/- 100 µm Min |
+/- 100 µm Max |
+/- 100 µm Standard deviation |
+/- 50 µm Average |
+/- 50 µm Min |
+/- 50 µm Max |
+/- 50 µm Standard deviation |
|
100 µm |
99.7% |
99.7% |
99.8% |
0.0% |
92.2% |
90.2% |
95.1% |
1.7% |
|
50 µm |
99.9% |
99.9% |
99.9% |
0.0% |
96.7% |
90.5% |
98.9% |
2.6% |
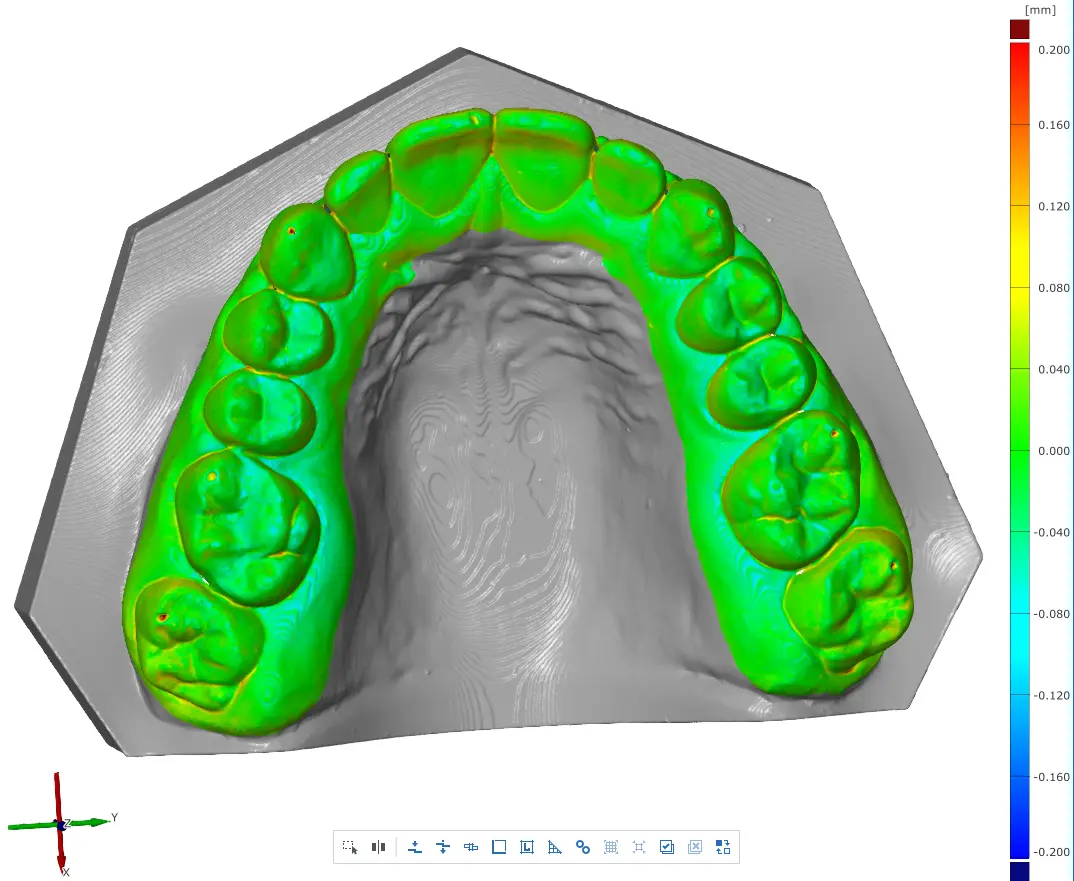
A scan of a restorative model printed at 100 µm layer height.
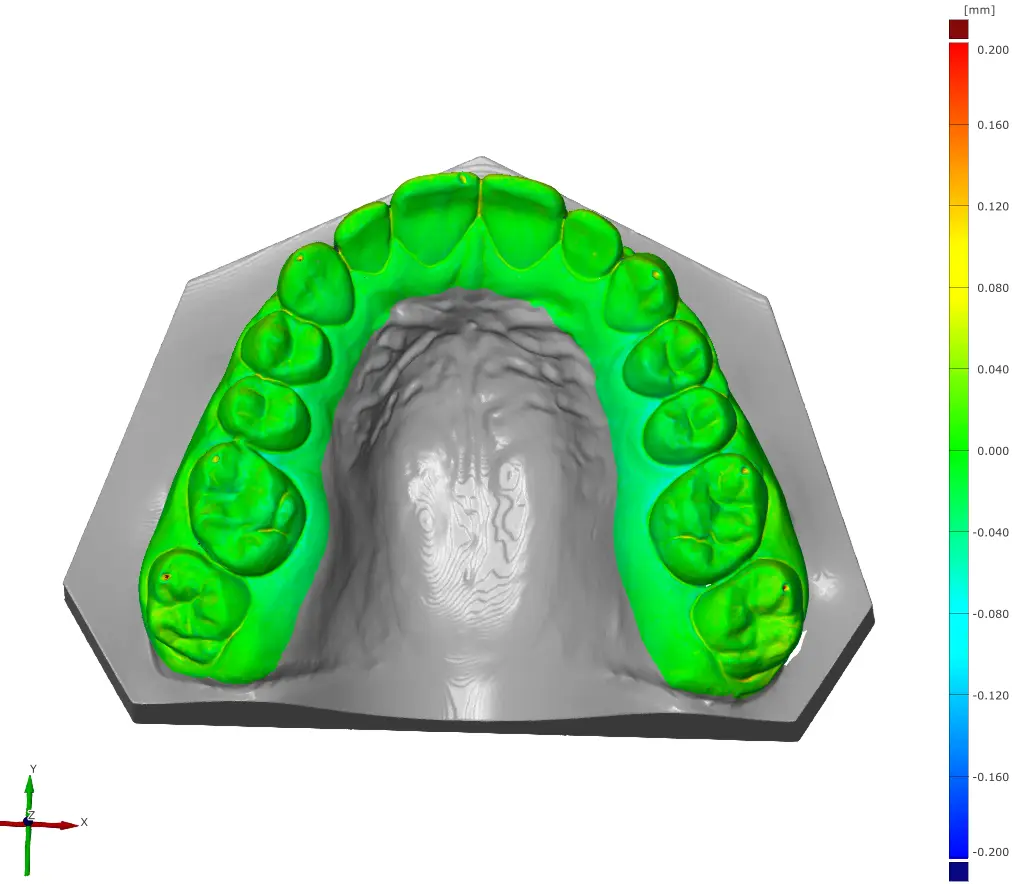
A scan of a restorative model printed at 50 µm layer height.
Biocompatible Applications
|
Resin |
Application |
Layer Height |
+/- 100 µm Average |
+/- 100 µm Min |
+/- 100 µm Max |
Standard deviation |
|
Dental LT Comfort Resin |
Occlusal splint |
100 µm |
81.2% |
74.2% |
90.0% |
6.0% |
|
Surgical Guide Resin |
Surgical guide |
100 µm |
97.8% |
92.4% |
99.7% |
2.4% |
These findings show that restorative models, occlusal splints, and surgical guides printed on Form 4BL are highly accurate, with percentages better than industry benchmarks.
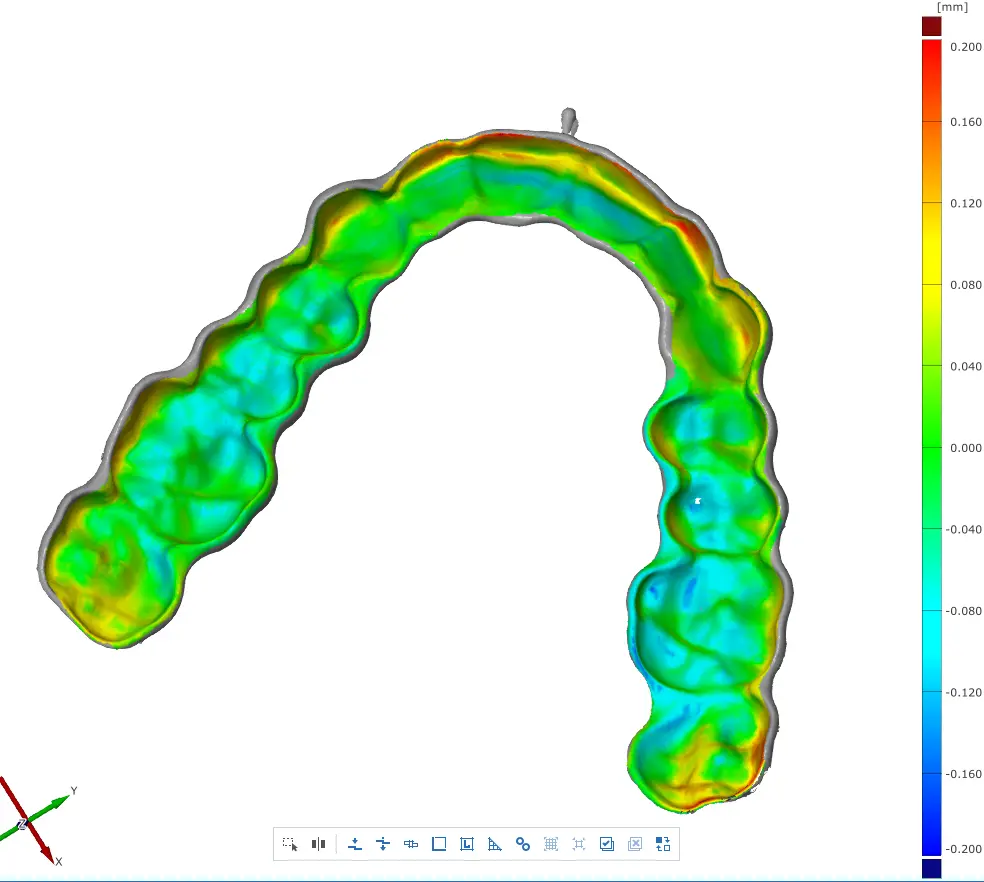
A scan of an occlusal splint printed at 100 µm layer height.
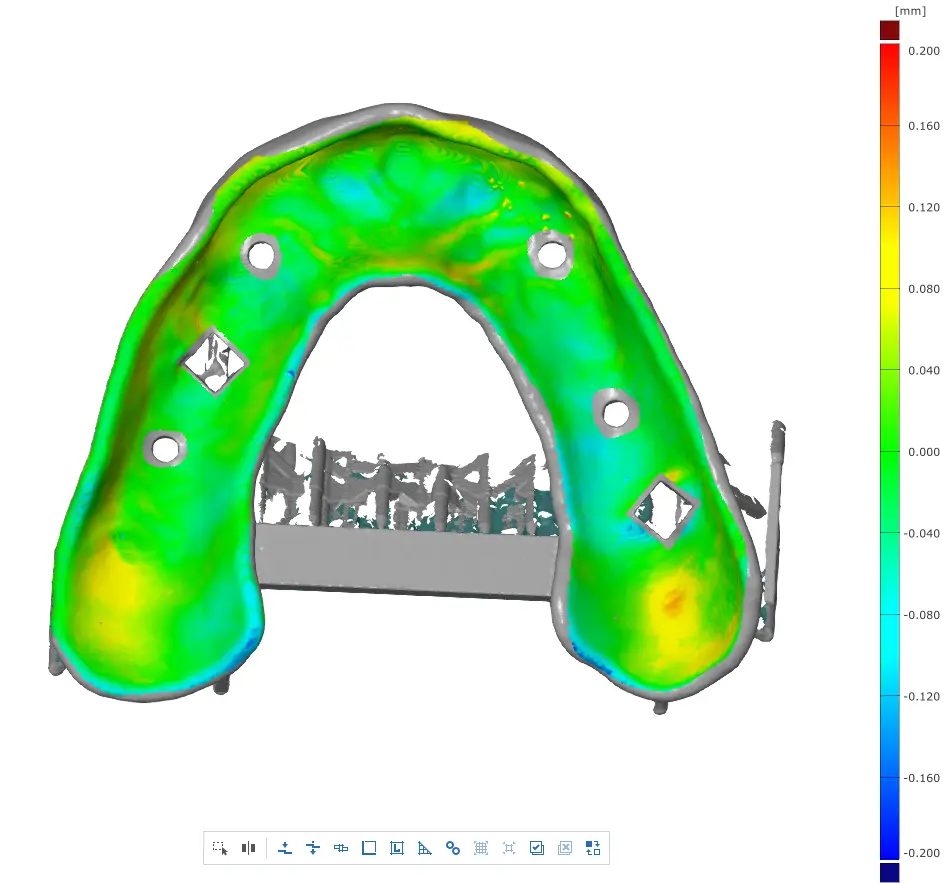
A scan of a surgical guide at 100 µm layer height.
Aligner Production Environment
In the aligner production environment, models are printed in a frame so that they can be spun after printing and cured in an inert environment.
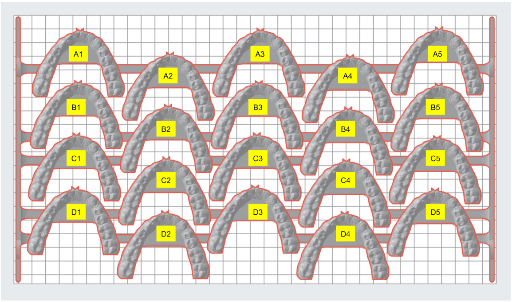
The models in a frame design for spinning. The letter/number identifiers indicate model placement on the frame and, therefore, on the build platform. These identifiers correspond to those in the table below.
Aligner models were printed using a custom Fast Model Resin formulation that Formlabs developed specifically for aligner production. Each model frame was printed three times on a different Form 4BL 3D printer at 160 μm layer height. After printing, frames were spun for four minutes, flipped, and then spun for another four minutes. Then, prints were post-cured in an inert environment before being individually scanned, giving insights into the accuracy across the build platform.
The table below shows the scan data for the three print batches.
|
Model Number |
Print Batch 1 (+/- 100 μm) |
Print Batch 2 (+/- 100 μm) |
Print Batch 3 (+/- 100 μm) |
|
A1 |
93.4% |
96.6% |
96% |
|
A2 |
94.2% |
95.7% |
96.7% |
|
A3 |
94.1% |
93.2% |
96.4% |
|
A4 |
91.4% |
95.8% |
95.8% |
|
A5 |
95.6% |
97.3% |
96.6% |
|
B1 |
95.1% |
92.1% |
96.2% |
|
B2 |
94.7% |
95% |
96.5% |
|
B3 |
92.9% |
95.8% |
95.9% |
|
B4 |
95.7% |
92.4% |
97.3% |
|
B5 |
96.2% |
96.7% |
96.4% |
|
C1 |
96.4% |
96.8% |
96.5% |
|
C2 |
96.3% |
94.8% |
96.6% |
|
C3 |
95.4% |
95.9% |
96.8% |
|
C4 |
96.6% |
94.9% |
96.8% |
|
C5 |
95.3% |
95.4% |
96.5% |
|
D1 |
97.2% |
96.1% |
98% |
|
D2 |
98.2% |
96.9% |
96.8% |
|
D3 |
96.1% |
90.2% |
97% |
|
D4 |
94.4% |
90.1% |
97% |
|
D5 |
96.2% |
97% |
97.1% |
|
Standard deviation |
1.57% |
2.188% |
0.506% |
|
Min |
91.4% |
90.1% |
95.8% |
|
Max |
98.2% |
97.3% |
98% |
|
Average of Models |
95.27% |
94.935% |
96.645% |
Scanned models ranged from 98.2-90.1% of the surface within 100 μm of the CAD model, with an average of 95.6% of surfaces within 100 μm of the CAD model.
Additional Value Indicators
Printer utilization can be a key indicator of user satisfaction: equipment that is broken or difficult to use will be used less often, while that which is easy to use and runs well will be run more often.
Return Merchandise Authorization Rate
A critical concern is the lifespan of equipment: does the printer fail in high-volume environments? One way to answer this is with the return merchandise authorization rate, or RMA rate. RMA rate is the percentage of hardware that must be replaced in relation to the total units deployed. A low RMA indicates that printers are working in the field and can hold up to high-volume demands.
As of March 31, 2026, in a sample set of over 3,800 Form 4L/BL 3D printers across all users, the RMA is <1.5%, demonstrating durability capable of supporting high-throughput manufacturing.
This <1.5% percent includes failures identified as:
-
Electrical issues with three printers
-
Z-axis issues (an irreplaceable component) with two printers
-
User experience issues with two printers
Resin Consumption
Reliability can also be inferred from consumption patterns. In unreliable ecosystems, resin usage plateaus as users struggle with downtime. Resin usage increases can be viewed as a proxy for satisfaction and indicates less downtime on working printers. Internal Formlabs data shows a steady and continual month-over-month increase in resin consumption for users of active Form 4 Generation 3D printers.
Net Promoter Score
While quantitative data is primary, qualitative feedback confirms the user experience. One way to determine this is a net promoter score (NPS). According to the creators of NPS, Bain & Company, an NPS of zero is good, over 20 favorable, and over 50 excellent, and over 70 is world-class, though these ranges do change based on industry. In the manufacturing hardware sector, an NPS greater than 50 is considered excellent.
Form 4 Generation 3D printers have an NPS score of 66, indicating that lab operators are actively recommending the platform to peers.
Evaluating Total Cost of Ownership for Form 4L/BL
With a CPP 47% less than that of leased industrial systems, a 97%+ print success rate, and consistent production of highly accurate parts, Form 4L/BL can deliver industrial throughput at a fraction of the cost of legacy leased industrial systems. When manufacturing one million parts, Form 4L 3D printers can save $453,657.60 versus leased industrial systems.
Whether you’re a dental lab printing models and biocompatible appliances or an aligner manufacturer, owning a fleet of Form 4 Generation 3D printers can reduce production costs and deliver superior CPP.
Calculating Total Cost of Ownership is vital for dental labs and aligner manufacturers investing in additive manufacturing equipment. Compared to leased legacy systems like the Carbon L1, Form 4L/BL 3D printers offer:
-
A CPP of $0.52 per model, 47% less than leased industrial systems;
-
A 97%+ print success rate;
-
Highly accurate models and biocompatible parts.
Ownership costs will vary business to business. To learn more about how fleets of Form 4 Generation 3D printers compare to legacy leased systems, read our white paper on operational equipment effectiveness (OEE). If you’re curious to see what this would look like for your business, contact our sales team to calculate your costs.